Creating mesh and electrodes.
This demo is implemented in a single Python file. tutorial_mesh.ipynb
This demo illustrates how to:
Create mesh based in eletrodes
Use
MyMesh()withelectrodes_position:from EIT_CEM_app import * %matplotlib inline
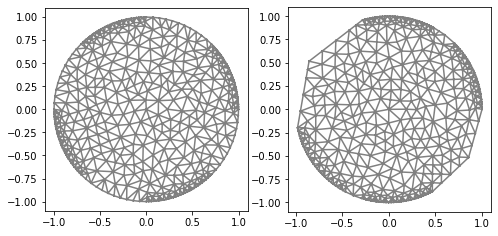
My first mesh!
"Mesh"
ele_pos1=electrodes_position(L=4, per_cober=0.8, rotate=0)
mesh1=MyMesh(r=1, n=7, n_in=15*2, n_out=3, electrodes_obj=ele_pos1)

"Rotated Mesh"
ele_pos2=electrodes_position(L=4, per_cober=0.8, rotate=pi/4*1.2)
mesh2=MyMesh(r=1, n=7, n_in=15*2, n_out=3, electrodes_obj=ele_pos2)

"Plot"
plt.figure(figsize=(8, 8))
plt.subplot(1,2,1)
plot(mesh1);
plt.subplot(1,2,2)
plot(mesh2);
Checking and changing the electrodes position.
Verificando as posições no eletrodo
We can use electrodes_position.position to check the initial and final of each electrode:
ele_pos1=electrodes_position(L=4, per_cober=0.5, rotate=0)
ele_pos1.position
>>>[[0.0, 0.7853981633974483],
   [1.5707963267948966, 2.356194490192345],
   [3.141592653589793, 3.9269908169872414],
   [4.71238898038469, 5.497787143782138]]
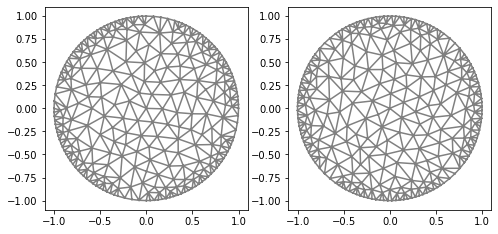
Mudando a posição manualmente.
"Mesh"
ele_pos1=electrodes_position(L=4, per_cober=0.5, rotate=0)
mesh1=MyMesh(r=1, n=10, n_in=30, n_out=10, electrodes_obj=ele_pos1)

"Alternative position"
ele_pos2=electrodes_position(L=4, per_cober=0.5, rotate=0)
ele_pos2.position=[
 [0.0, 0.7853981633974483],
 [1.0707963267948966, 1.856194490192345],
 [3.341592653589793, 4.2269908169872414],
 [4.41238898038469, 5.197787143782138]]
mesh2=MyMesh(r=1, n=10, n_in=30, n_out=10, electrodes_obj=ele_pos2)

"Plot"
plt.figure(figsize=(8, 8))
plt.subplot(1,2,1)
plot(mesh1);
plt.subplot(1,2,2)
plot(mesh2);
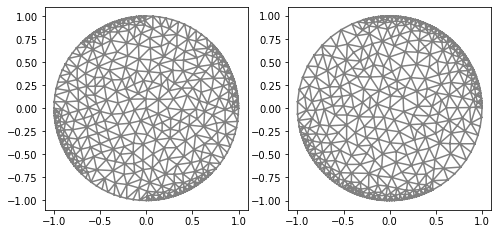
Fixing excessive cells::
To fix the number of vertex in the gaps or in electrodes is just change n_out. If we express n_out as an array, like n_out=[2,10,2,10] the number of vertex will be different in each selected gap and avoid desnecessary cells.:
mesh2=MyMesh(r=1, n=10, n_in=30, n_out=[2,10,2,10], electrodes_obj=ele_pos2)

"Plot"
plt.figure(figsize=(8, 8))
plt.subplot(1,2,1)
plot(mesh1);
plt.subplot(1,2,2)
plot(mesh2);
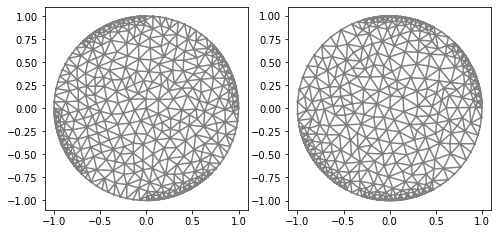
Warning
Watch out for the number of vertices added to the gaps or electrodes.:
mesh2=MyMesh(r=1, n=10, n_in=30, n_out=[1,1,1,1], electrodes_obj=ele_pos2)

"Plot"
plt.figure(figsize=(8, 8))
plt.subplot(1,2,1)
plot(mesh1);
plt.subplot(1,2,2)
plot(mesh2);