Forward Problem
This demo is implemented in a single Python file. Download here: tutorial_forward.ipynb
This demo illustrates how to:
How to use
ForwardProblem.:from module1_mesh import* from module2_forward import* from module3_inverse import* from module4_auxiliar import* import matplotlib.pyplot as plt %matplotlib inline
Mesh
"Electrodes and Mesh"
ele_pos=electrodes_position(L=16, per_cober=0.5, rotate=0)
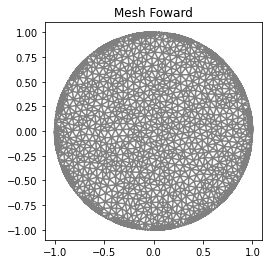
mesh_refined=MyMesh(r=1, n=10*2, n_in=8*10, n_out=3*2, electrodes_obj=ele_pos)
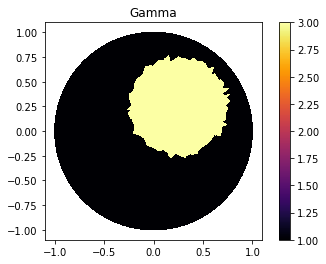
Defining Gamma function
ValuesCells0=GammaCircle(mesh_refined,3.0,1.0,0.50, 0.25, 0.25);
Q = FunctionSpace(mesh_refined, "DG", 0) #Define Function space with basis Descontinuous Galerkin
gamma0 = Function(Q)
gamma0.vector()[:]=ValuesCells0


"Plot"
plot_figure(gamma0, name="")
Forward Problem
"Forward Problem"
L=16
VD=FiniteElement('CG',mesh_refined.ufl_cell(),1) #Lagrange pol. degree 1
l=int(L)                                        #Measurements number.
z=np.ones(L)*0.025E-5                           #Impedance
I_all=current_method(L,l, method=2, value=1)    #Current pattern

ForwardObject=ForwardProblem(mesh_refined, z)

VD=FiniteElement('CG',mesh_refined.ufl_cell(),1) #Solution Space Continous Galerkin
list_u0,list_U0 = ForwardObject.solve_forward(VD, I_all, gamma0)
list_U0 = (np.array(list_U0).flatten())
Checking Results
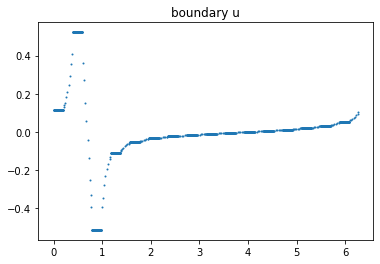
Boundary plot
index=1
u_data=getBoundaryVertex(mesh_forward, list_u0[index]);
data_u0=plot_boundary(mesh_forward, data=u_data, name='boundary u', line=0);
Complete Electrode models hyphotesis
data = ForwardObject.verify_solution_graphs(gamma0, sol_index=0, method=1)
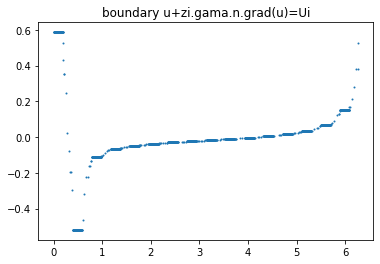
data = ForwardObject.verify_solution_graphs(gamma0, sol_index=0, method=2)
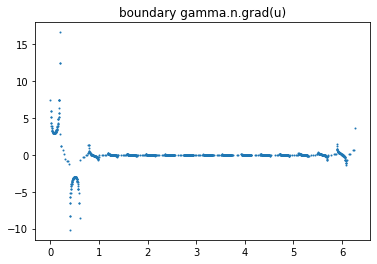
data = ForwardObject.verify_solution_graphs(gamma0, sol_index=0, method=3)
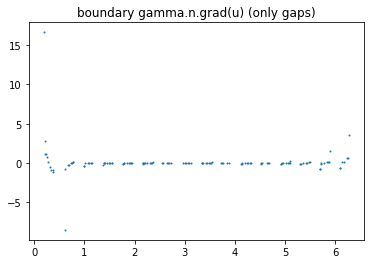
>>> ForwardObject.verify_solution_values(I_all, gamma0, sol_index=0, method=1)

    Current values
    Calculated: 0.8323 Expected: 1.0
    Calculated: -0.8028 Expected: -1.0
    Calculated: -0.0019 Expected: 0.0
    Calculated: -0.0012 Expected: 0.0
    Calculated: -0.0004 Expected: 0.0
    Calculated: -0.0001 Expected: 0.0
    Calculated: 0.0001 Expected: 0.0
    Calculated: 0.0001 Expected: 0.0
    Calculated: 0.0001 Expected: 0.0
    Calculated: 0.0002 Expected: 0.0
    Calculated: 0.0 Expected: 0.0
    Calculated: 0.0001 Expected: 0.0
    Calculated: -0.0002 Expected: 0.0
    Calculated: 0.0005 Expected: 0.0
    Calculated: 0.0012 Expected: 0.0
    Calculated: 0.0074 Expected: 0.0
    Soma das correntes calculada:  0.03517066018683186
>>> ForwardObject.verify_solution_values(I_all, gamma0, sol_index=0, method=2)
    Potential values
    Calculated: 0.58677 Expected: 0.58677
    Calculated: -0.51934 Expected: -0.51934
    Calculated: -0.11312 Expected: -0.11312
    Calculated: -0.06419 Expected: -0.06419
    Calculated: -0.04701 Expected: -0.04701
    Calculated: -0.03692 Expected: -0.03692
    Calculated: -0.02935 Expected: -0.02935
    Calculated: -0.02291 Expected: -0.02291
    Calculated: -0.01683 Expected: -0.01683
    Calculated: -0.01057 Expected: -0.01057
    Calculated: -0.0036 Expected: -0.0036
    Calculated: 0.00492 Expected: 0.00492
    Calculated: 0.01642 Expected: 0.01642
    Calculated: 0.03434 Expected: 0.03434
    Calculated: 0.06799 Expected: 0.06799
    Calculated: 0.15339 Expected: 0.15339
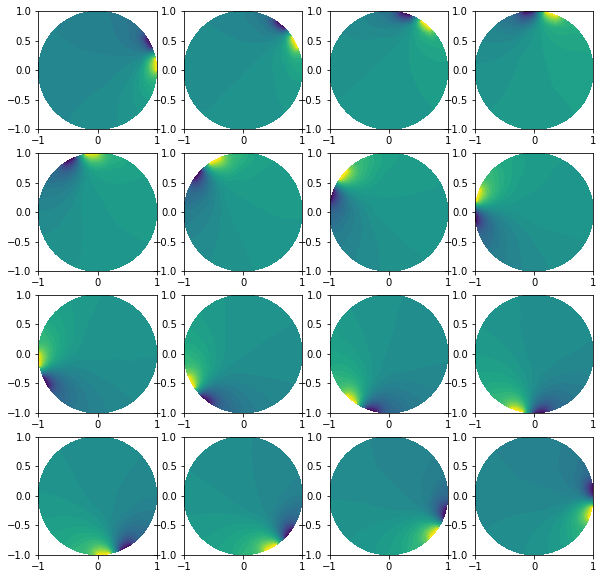
Plot solutions
plt.figure(figsize=(10, 10))
for i in range(0, l):
    plt.subplot(4,4,i+1)
    plot(list_u0[i])
Add noise
"Getting noised solution"
noise_level=0.05
noise_type='uniform'
if noise_level>1E-10: list_U0_noised = ForwardObject.add_noise(noise_level, noise_type, seed=1)
Plotting noise
"Plot electrodes noise."
index=4 #Index in array

vec_U0_noise=list_U0_noised[index*L:(index+1)*L]
vec_U0=list_U0[index*L:(index+1)*L]
x=range(len(vec_U0_noise))

"Plot"
plt.figure(figsize=(14, 5),)
plt.subplot(1,2,1)
plt.plot(x, vec_U0_noise, linewidth=0,  marker='.', markersize=5, label="noise", color='red');
plt.plot(x, vec_U0, linewidth=0,  marker='*', markersize=5, label="no_noise", color="blue");
plt.legend()

plt.subplot(1,2,2)
plt.plot(x, vec_U0-vec_U0_noise, linewidth=1,  marker='.', markersize=10, label="noise", color="blue");
plt.legend()

plt.show()
